Properly testing how your IoT solution will react to incoming sensor data can be challenging. Today's release makes this quick and easy with the new device simulator.
IoT Device Simulator
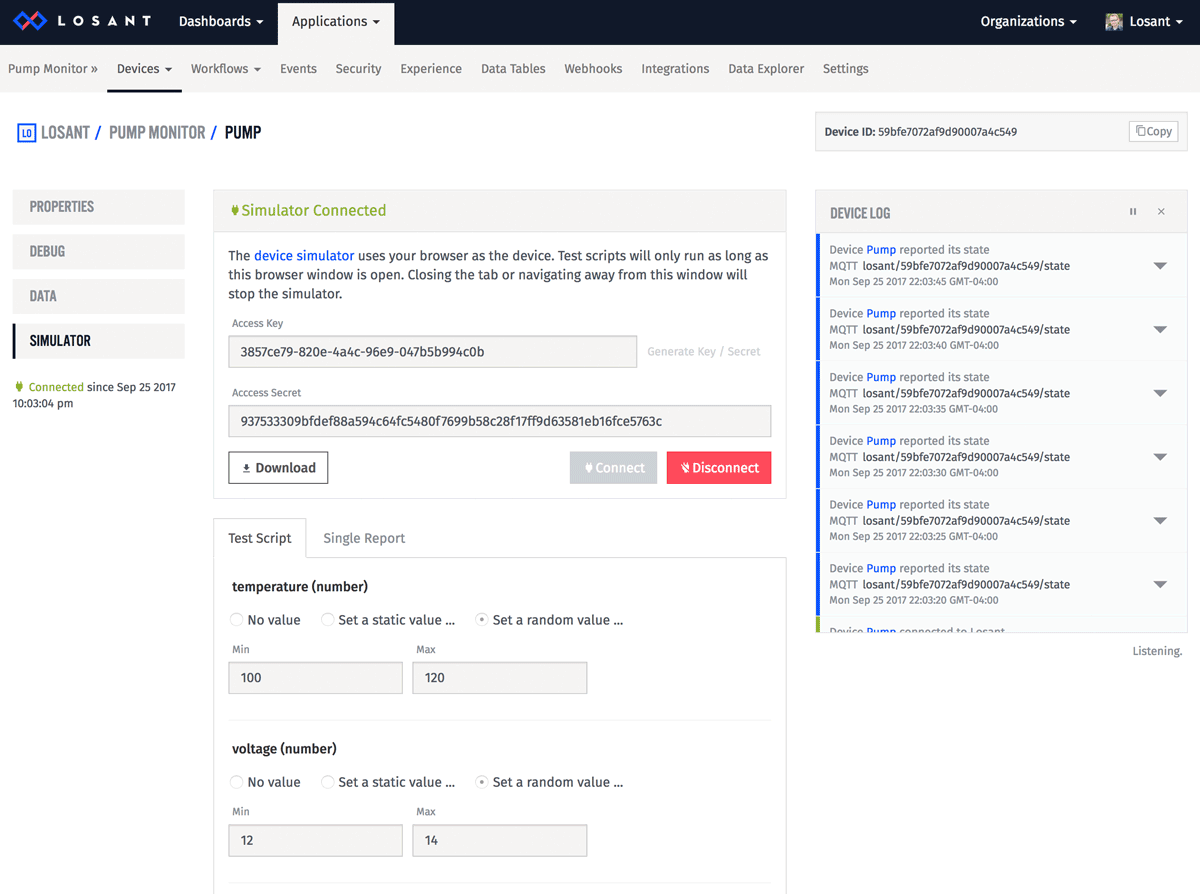
The device simulator can be reached using the new Simulator tab available on every device's overview page. The simulator works by using your browser as the device. Once your browser is connected, you can configure Test Scripts to periodically send random data, or use the Single Report tab to send a specific value.

A common scenario is to use a Test Script to periodically report "normal" data. While that's running, you can use the Single Report tab to inject an anomalous data point. This provides a way to easily test any alerting or notification workflows you've designed based on erroneous incoming data.
The Device Log
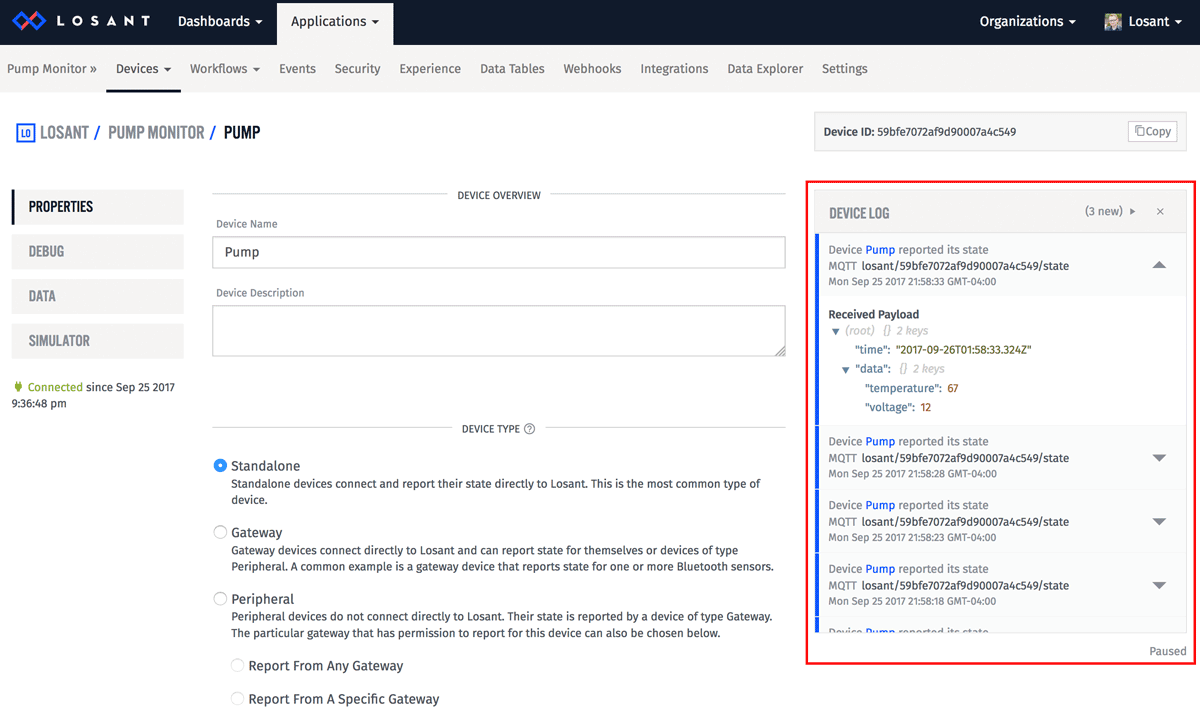
This release also brings a better way to debug device connectivity and communication. On every device overview page there is now a communication log on the right. This is a real-time log of all communication for this device.

Much like the application communication log, the new device log makes it easy to debug common issues like connects and disconnects, authentication issues, and more.
Other Updates
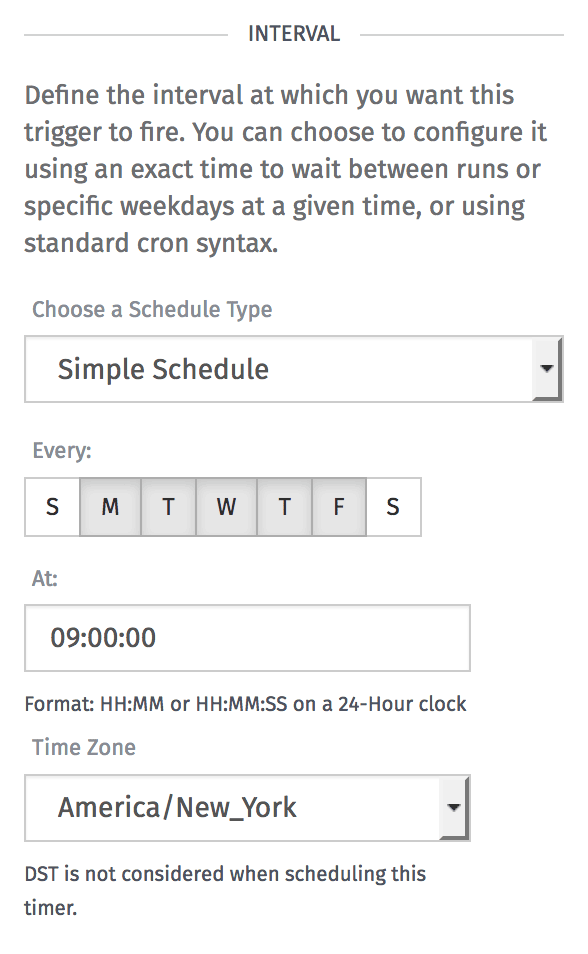
- The Timer Trigger now supports a simpler configuration for time of day and day of week.

- You can now delete Data Table rows using a query with the Table: Delete Rows node. Prior to this release, you could only delete rows by specifying a single row ID.
- The Input Controls dashboard block now supports a dropdown selector control.
- When bulk importing devices, you can now automatically generate an access key and secret for each device.
What's Next?
As always, many of our new features and improvements come directly from user suggestions. If you have something you'd like to see become part of our platform, please let us know in our forums.
