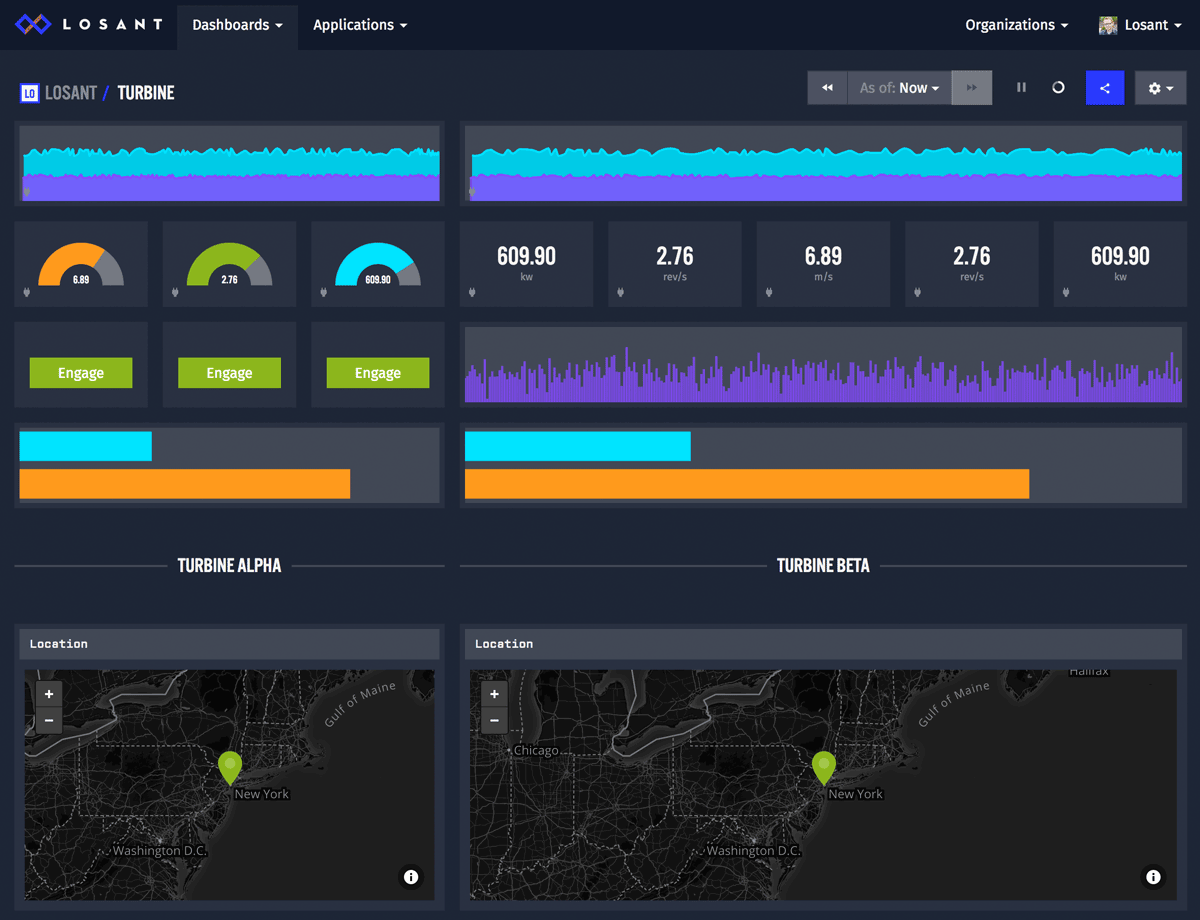
Today's platform update provides a way to show much more data on your Losant dashboards. We've also added a new section header block to label and separate various parts of larger dashboards.
Mini Dashboard Blocks
With today's release, we've essentially doubled the number of cells in the underlying dashboard grid, which provides you with the ability to put twice as many blocks in the same space. We've also optimized every dashboard block to work at the smaller size.

Section Header Block
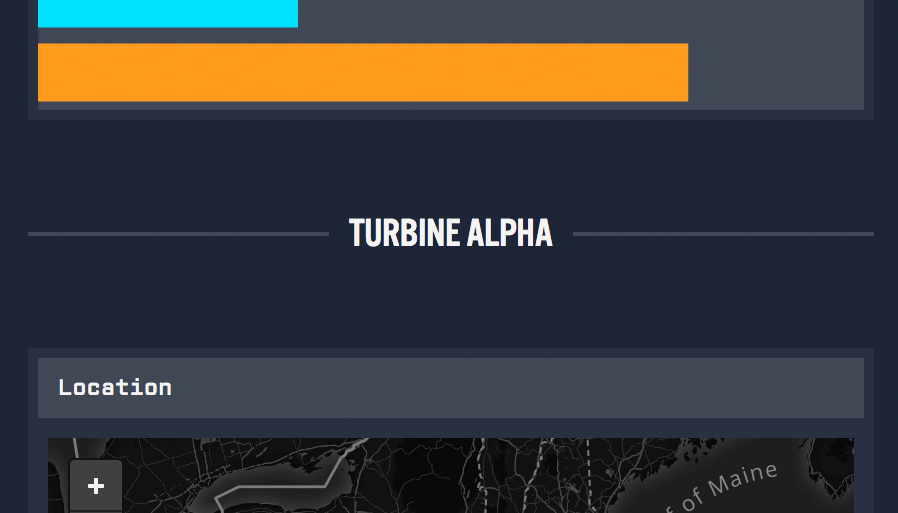
On larger dashboards, it can sometimes be convenient to label specific sections. To accomplish this, we've added a new Section Header dashboard block.

A section header is placed and resized exactly like any other block. The section header also supports a description if your section requires additional explanation.
Other Updates
- The debug panel now shows a stack trace if a Function Node throws an exception.
- If there's a network or connectivity error, dashboard blocks will now display a small error icon on the bottom-left corner.
What's Next?
With every new release, we really listen to your feedback. By combining your suggestions with our roadmap, we can continue to make the platform easy for you. Let us know what you think in the Losant Forums.
